The importance of multi-hazard considerations for building community and infrastructure resilience
Dr Mitchell Anderson
Co-founder and Chief Executive Officer
5 min

Multi-hazard events carry the largest losses and consequences to our communities. Reclassified EM-DAT records show that 19% of documented events can be classed as multi-hazard, yet those events accounted for 59% of global damage and losses. Yet failing to consider multi-hazard in land use, asset, emergency, and adaptation planning produces uninformed decisions, poor prioritisation and resource allocation, and, in some cases, increased risk.
Almost every place on Earth faces more than one natural hazard. Yet the way we assess, plan for, and communicate risk in these multi-hazard environments often ignores how hazards overlap, interact, or compound.
Intuitively, we can all picture a coastal community that sits between mountainous terrain and the sea, rich with aquifers that supply rural communities and agriculture, and a river flowing through the town out to the coast. Ask anyone in that community what hazards could affect them, and you’ll quickly build up that multi-hazard landscape.
Multiple hazards are a reality of the world we live in and can be independent or inherently interrelated. Some municipal boundaries carry prevalence from (relatively) independent events such as flooding and wildfires. While in other areas, earthquakes may induce both tsunami and rockfall (or rockfall followed by inland tsunami), which may create landslide dams and associated flash flooding upon their breach. Equally, drought and high winds can often set the preconditions for intense wildfire spreading and impacts. Alternatively, heavy rain can cause landslides in upper catchment areas and exacerbate downstream flooding, particularly where storm surge further reduces river and stormwater drainage capacity.
With growing populations and increasingly interconnected and interdependent systems, our communities are beginning to see and feel the impacts of the multiple hazards more and more. Not to mention the increased frequency and intensity of some hazards under changing climate conditions.
This article is for decision-makers and analysts working in multi-hazard environments. It sets out how hazards relate to one another, what the research says about assessing them separately, and the three levels at which their impacts can be combined in practice.
Why multi-hazard matters
Multi-hazard events carry the largest losses and consequences to our communities. Reclassified EM-DAT records show that 19% of documented events can be classed as multi-hazard, yet those events accounted for 59% of global damage and losses. Yet failing to consider multi-hazard in land use, asset, emergency, and adaptation planning produces uninformed decisions, poor prioritisation and resource allocation, and, in some cases, increased risk. Specifically, we see this as:
Underestimated risk and resourcing. Funding, whether through long-term plan allocations or national/federal grants, is sized against the risk the evidence describes. Leaving infrastructure utilities and local government both underfunded to manage their risk but also unable to communicate risk to the people carrying it.
Investment prioritised at the wrong assets or communities. Asset management plans, capital works and community adaptation all draw on the same ranking. When that ranking is wrong, we miss opportunities to maximise risk reduction while also leaving some communities and assets at disproportionately high risk for longer than they should, increasing the likelihood that future events result in more severe consequences.
Path dependency and lock-in. Property and infrastructure decisions often carry design lives of fifty years and more. A zoning or infrastructure decision made against one hazard may increase exposure to another and, once development occurs, constrain the feasible options for managing that risk later.
Maladaptation. Lowering risk from one hazard can inadvertently raise it from another. A community relocated out of coastal inundation may be placed on liquefiable ground. A seawall that reduces flooding at one site can increase erosion along the coast from it.
Regulators are converging on a combined view
The Sendai Framework has called since 2015 for a multi-hazard approach to the management of disaster risk at all levels and across all sectors.
Individual jurisdictions are now writing that into law. In Aotearoa New Zealand, the National Policy Statement for Natural Hazards requires flooding, landslides, coastal erosion, coastal inundation, active faults, liquefaction and tsunami to be weighed in resource consent decision-making. The Emergency Management Bill reframes lifeline utilities as essential infrastructure providers with a duty to ensure services can function to the fullest possible extent during emergencies, and service continuity is inherently multi-hazard. In Australia, the NSW Reconstruction Authority Act 2022 requires Disaster Adaptation Plans that bring together information about a range of natural hazards for a specific location.
The state of multi-hazard science
Research into multi-hazard risk has grown steadily for the last three decades. With the most recent classification framework released earlier this year in the Journal of Natural Hazards, Wenzel et al. aptly describes the gap between science and practice, despite the volume of work in the field, there is still a lack of application of these ideas in practical disaster risk management. They point to one reason familiar to anyone working in local government: new concepts must be integrated into legal structures built on historical precedents, sector-specific regulation, and jurisdictional boundaries - most of which do not easily accommodate a multi-hazard perspective.
Before arguing about what to do, it helps to understand what is being described. The recent Wenzel framework separates hazard interrelation into three independent dimensions, which is more useful than treating "multi-hazard" as a single idea.
Type is the nature of the relationship. Hazards can be independent, occurring autonomously through separate processes. They can be trigger-coupled, where a single external event causes several hazards at once. They can be cascading, where one hazard causes or contributes to the occurrence of another. Or they can be pre-conditioning, where one event alters the landscape so that another becomes more likely or more severe.
Space is how they align geographically. Footprints can overlap, wholly or partly, so that several hazard types reach the same assets. One hazard can act as a source from which hazardous effects spread into other areas. Or non-overlapping hazards that can occupy entirely different areas and still interact through shared response capacity.
Time is how the events sit relative to each other and to recovery. Simultaneous, consecutive before a system has recovered, or distant, when recovery is complete.
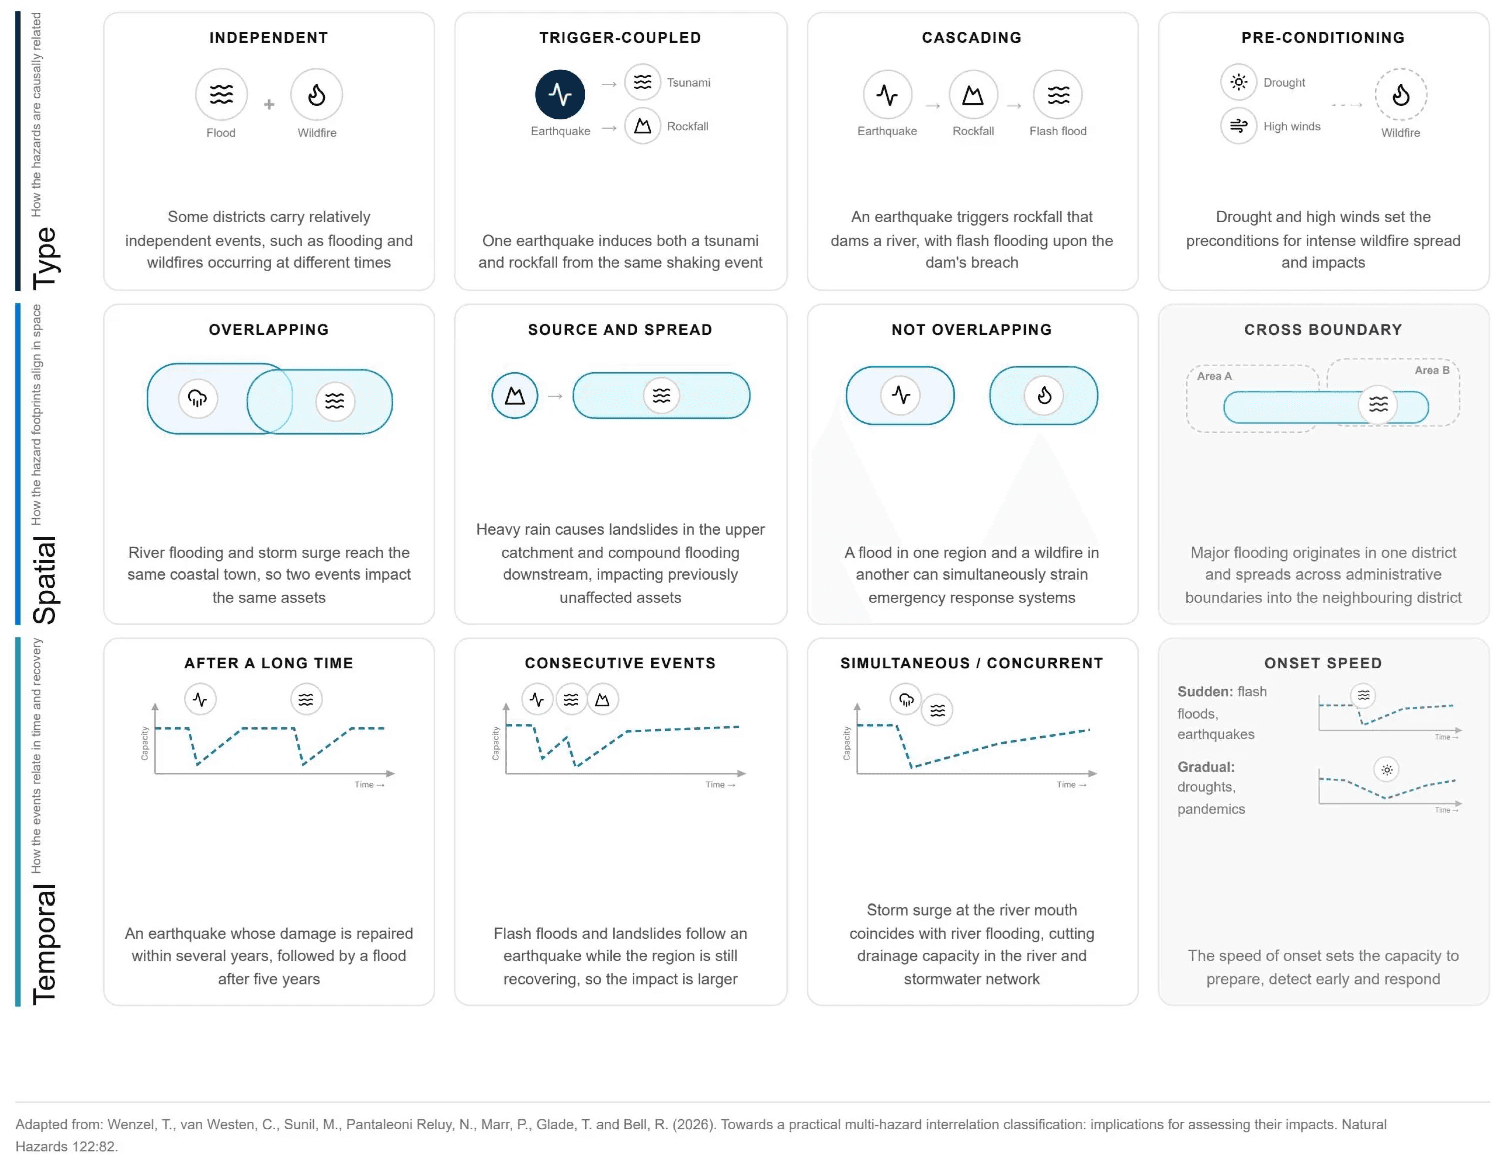
The TST framework above is a helpful framing with implications for both hazard modelling and the subsequent risk assessment that forms the evidence base for decisions.
Implications for hazard, exposure and vulnerability, and loss assessments
Hazard modelling variations
Independent. Conventional separate models, one per hazard.
Sequential. The output of the first model becomes the input to the second, either directly where one hazard triggers another, or indirectly where one changes the environment the next lands on.
Joint physically-based. Interacting hazards simulated within a single event, influencing both the spatial extent and intensities.
Empirical interaction. Statistical or machine learning methods standing in for the joint and sequential cases where the physics is intractable.
Exposure and impact-function variations
Joint. Simultaneous overlapping footprints. A single vulnerability curve where the hazards share an intensity measure, a vulnerability surface where intensities differ.
Sequential. Consecutive events arriving before recovery. Assets destroyed by the first are excluded, and the rest carry into the second in a reduced condition, using a damage-adjusted curve.
Separate. Footprints sitting apart, or recovery complete before the next event. Original curves, assessed independently and aggregated.
Loss assessment: Losses are assessed at asset level and aggregated afterwards, where total direct loss must be capped at the value of the asset. The conventional approach calculates losses separately per hazard and sums them, which is useful for general planning but does not fully reflect cascading or simultaneous interactions. Moving beyond this requires improved frequency measures for the different multi-hazard types: trigger frequency for coupled hazards, event trees for cascading, conditional probability for pre-conditioning, and summed risk curves for independent hazards.
Form | When it applies | Equation |
Combined intensity | Overlapping footprints, simultaneous events, where intensities merge into a single hazard or a joint vulnerability surface applies |
or |
Capped sum | Overlapping footprints, losses assessed separately per hazard |
|
Residual value | Consecutive events, second arriving before recovery |
|
Regional sum | Footprints do not overlap, different assets affected |
|
A = asset value, V = vulnerability, VH2|H1 = vulnerability to hazard 2 given hazard 1 has occurred, H = hazard, L = loss, Max(A) = maximum possible loss, equal to asset value.
Making multi-hazard the standard
Due to the variability in hazard modelling inputs, and the often manual and time-intensive process of spatial natural hazard risk assessments, these frameworks and their implications are seldom adopted in practice.
As part of Resilience Explorer®, we've set out from the beginning to ensure multi-hazard is the rule rather than the exception. In the interactive video below, you'll see three examples that demonstrate how quickly each of the three methods can be applied, and how the results are communicated.
Separate. Liquefaction and flooding, temporally distant. Footprints assessed independently with original vulnerability curves, then aggregated.
Joint. Landslide and compound flooding from a single rainfall driver, arriving together. Overlapping footprints combined and read against a single curve where the hazards share an intensity measure.
Sequential. Earthquake and tsunami in close succession. Assets already destroyed are excluded, and those remaining carry into the second hazard in a reduced condition.
Read more about our multi-hazard processing, communication, and prioritisation here:
References:
Wenzel, Till, Cees van Westen, Mariya Sunil, Núria Pantaleoni Reluy, Philipp Marr, Thomas Glade, and Rainer Bell. 2026. “Towards a Practical Multi-Hazard Interrelation Classification: Implications for Assessing Their Impacts.” Natural Hazards (Dordrecht, Netherlands) 122 (2): 82.
Multi-hazard risk assessment for resilience planning | Resilience Explorer®
Multi-hazard events make up 19% of recorded disasters but 59% of losses. How hazards interact and how to combine their impacts in risk assessment.